The Anomaly Detection page is used to configure anomaly detection settings for IFS Cloud EAM test point parameters. It allows administrators to review EAM test point parameter details, associate test point parameters with template attributes, and specify a schedule. These configurations create and update corresponding monitors in Sentinel.
The page is available under the EAM menu. It displays hierarchies synchronised from EAM and allows anomaly detection settings to be configured for individual entities.
Users with the EAM Admin privilege can configure anomaly detection settings. Users without the required privilege can access the page, but all configuration settings are displayed in read-only mode.
Opening Anomaly Detection Table
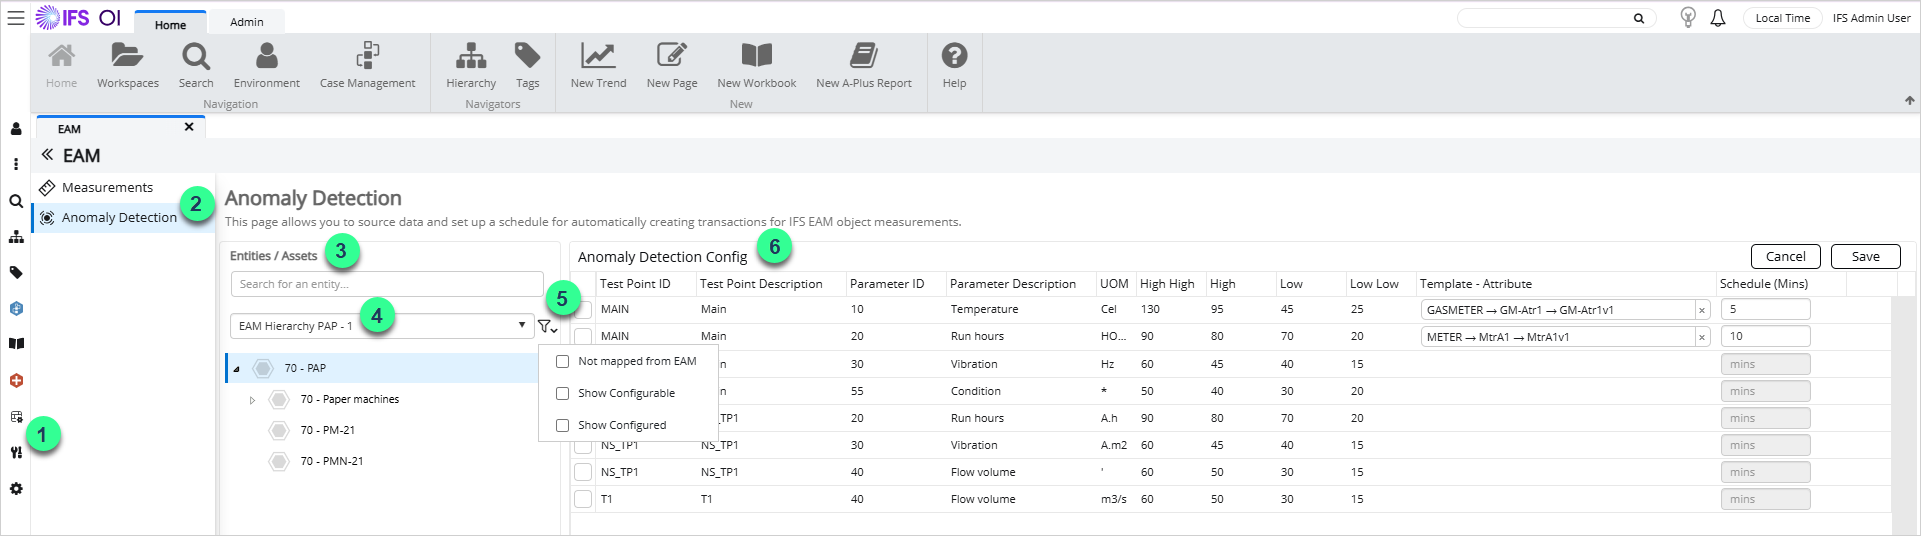
1. Click the EAM icon in the navigation menu.
2. Select the Anomaly Detection page.
3. A hierarchy can be selected from the Entities / Assets list.
4. Browse the hierarchy tree and select an entity.
5. The Filter menu can be used to display entities that are not mapped from EAM, entities that can be configured, or entities that already have measurement configurations.
6. The anomaly detection configurations for the selected entity are displayed in the Anomaly Detection Config table.
Configuring Anomaly Detection
The Anomaly Detection page displays the anomaly detection configuration for the selected entity. It allows you to:
- Review EAM test point parameter details.
- Associate test point parameters with template attributes.
- Configure how frequently anomaly detection monitors run.
After making any changes, click Save to apply them.
Anomaly Detection Configuration Table
The Anomaly Detection Config table displays the available EAM test point parameters for the selected entity and allows anomaly detection settings to be configured.

| Test Point ID |
The identifier of the EAM test point associated with the selected parameter. |
| Test Point Description |
The description of the test point retrieved from EAM. |
| Parameter ID |
The identifier of the parameter associated with the selected test point. |
| Parameter Description | The name or description of the parameter, e.g. Temperature, Pressure. |
| UOM |
The unit of measure associated with the parameter value. |
| High High, High, Low, Low Low |
Displays the limit values used by the anomaly detection configuration. |
| Template - Attribute |
Specifies the Explorer template attribute mapping associated with the selected EAM test point parameter. |
| Schedule |
Specifies how frequently the corresponding anomaly detection monitor runs. |
Template - Attribute
Template - Attribute shows the configured template attribute mapping associated with the selected EAM test point parameter.
The value is displayed in the format: `Template → Attribute → Attribute Value`.
If a Template - Attribute mapping has already been configured for the same test point parameter on the Measurements page, the mapping is displayed automatically.
Note:
• A Template-Attribute-Attribute Value combination can only be configured once for the same entity.
• Template-Attribute-Attribute Value mappings are shared between the Measurements and Anomaly Detection configuration tables. Adding, updating, or removing a mapping in one table affects the other table.
Alarm Limits
The High High, High, Low, and Low Low fields display the limit values associated with the selected test point parameter.
- High High defines the upper critical limit.
- High defines the upper limit.
- Low defines the lower limit.
- Low Low defines the lower critical limit.
The configured values are used by the corresponding Sentinel monitor.
Schedule
The Schedule field specifies how frequently the anomaly detection monitor runs.
Note:
• A schedule is mandatory for each anomaly detection configuration.
• The Schedule field can only be configured when High High, High, Low, and Low Low values have been specified and a Template - Attribute mapping has been configured for the selected test point parameter.
Anomaly Detection - Sentinel Integration
Anomaly detection requires Sentinel to be configured and connected to Explorer.
Each anomaly detection configuration is linked to a monitor in Sentinel.
When a configuration is saved, Explorer creates or updates the monitor using the configured Template - Attribute mapping, alarm limits, and schedule.
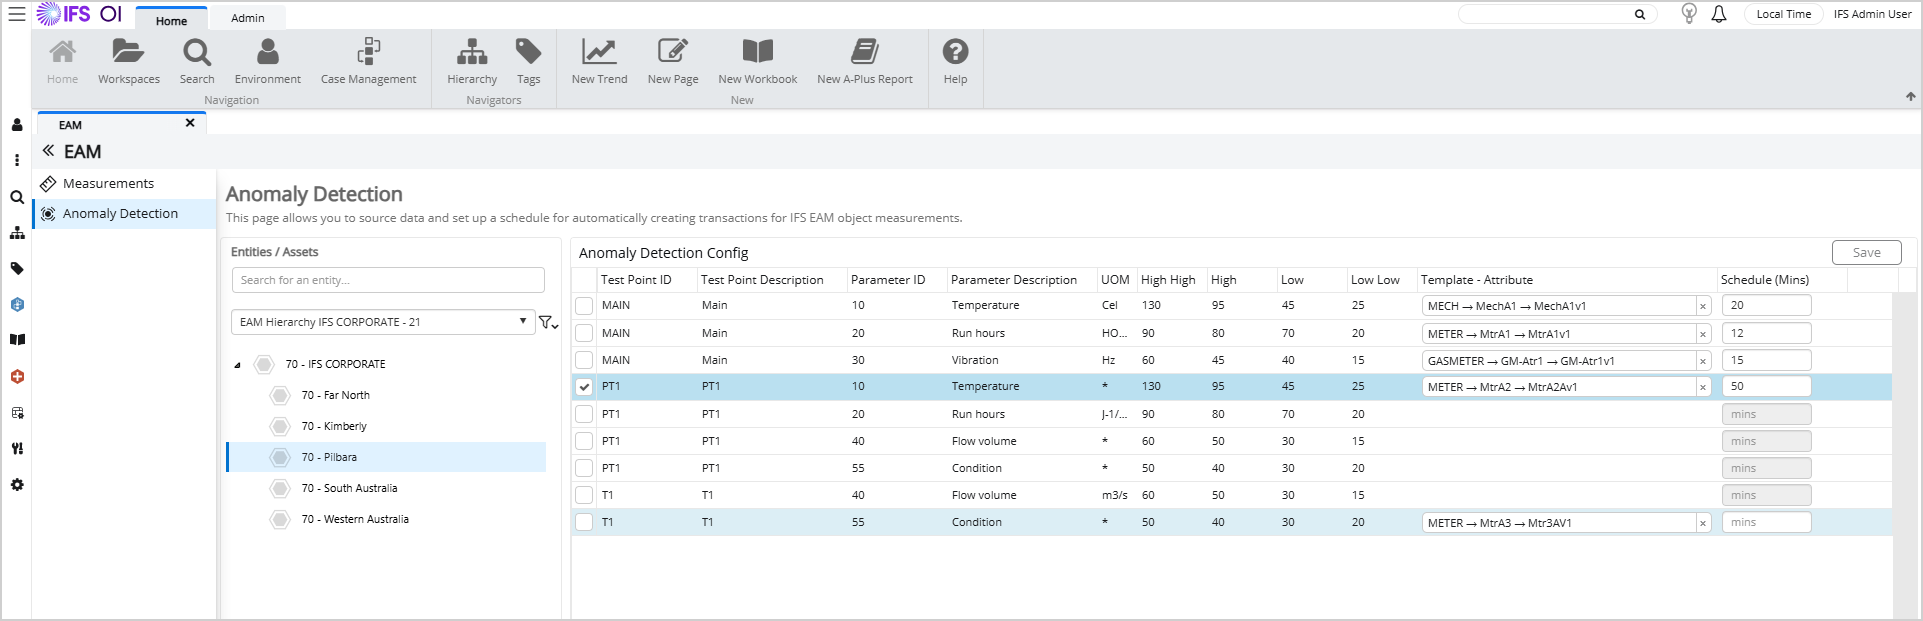
The following example shows an anomaly detection configuration in Explorer. In this example, the selected test point parameter includes alarm limits, a Template - Attribute mapping, and a schedule of 50 minutes.
After the configuration is saved, a corresponding monitor is created in Sentinel. The monitor uses the configured Template - Attribute mapping, alarm limits, and schedule to identify anomalies for the selected entity.
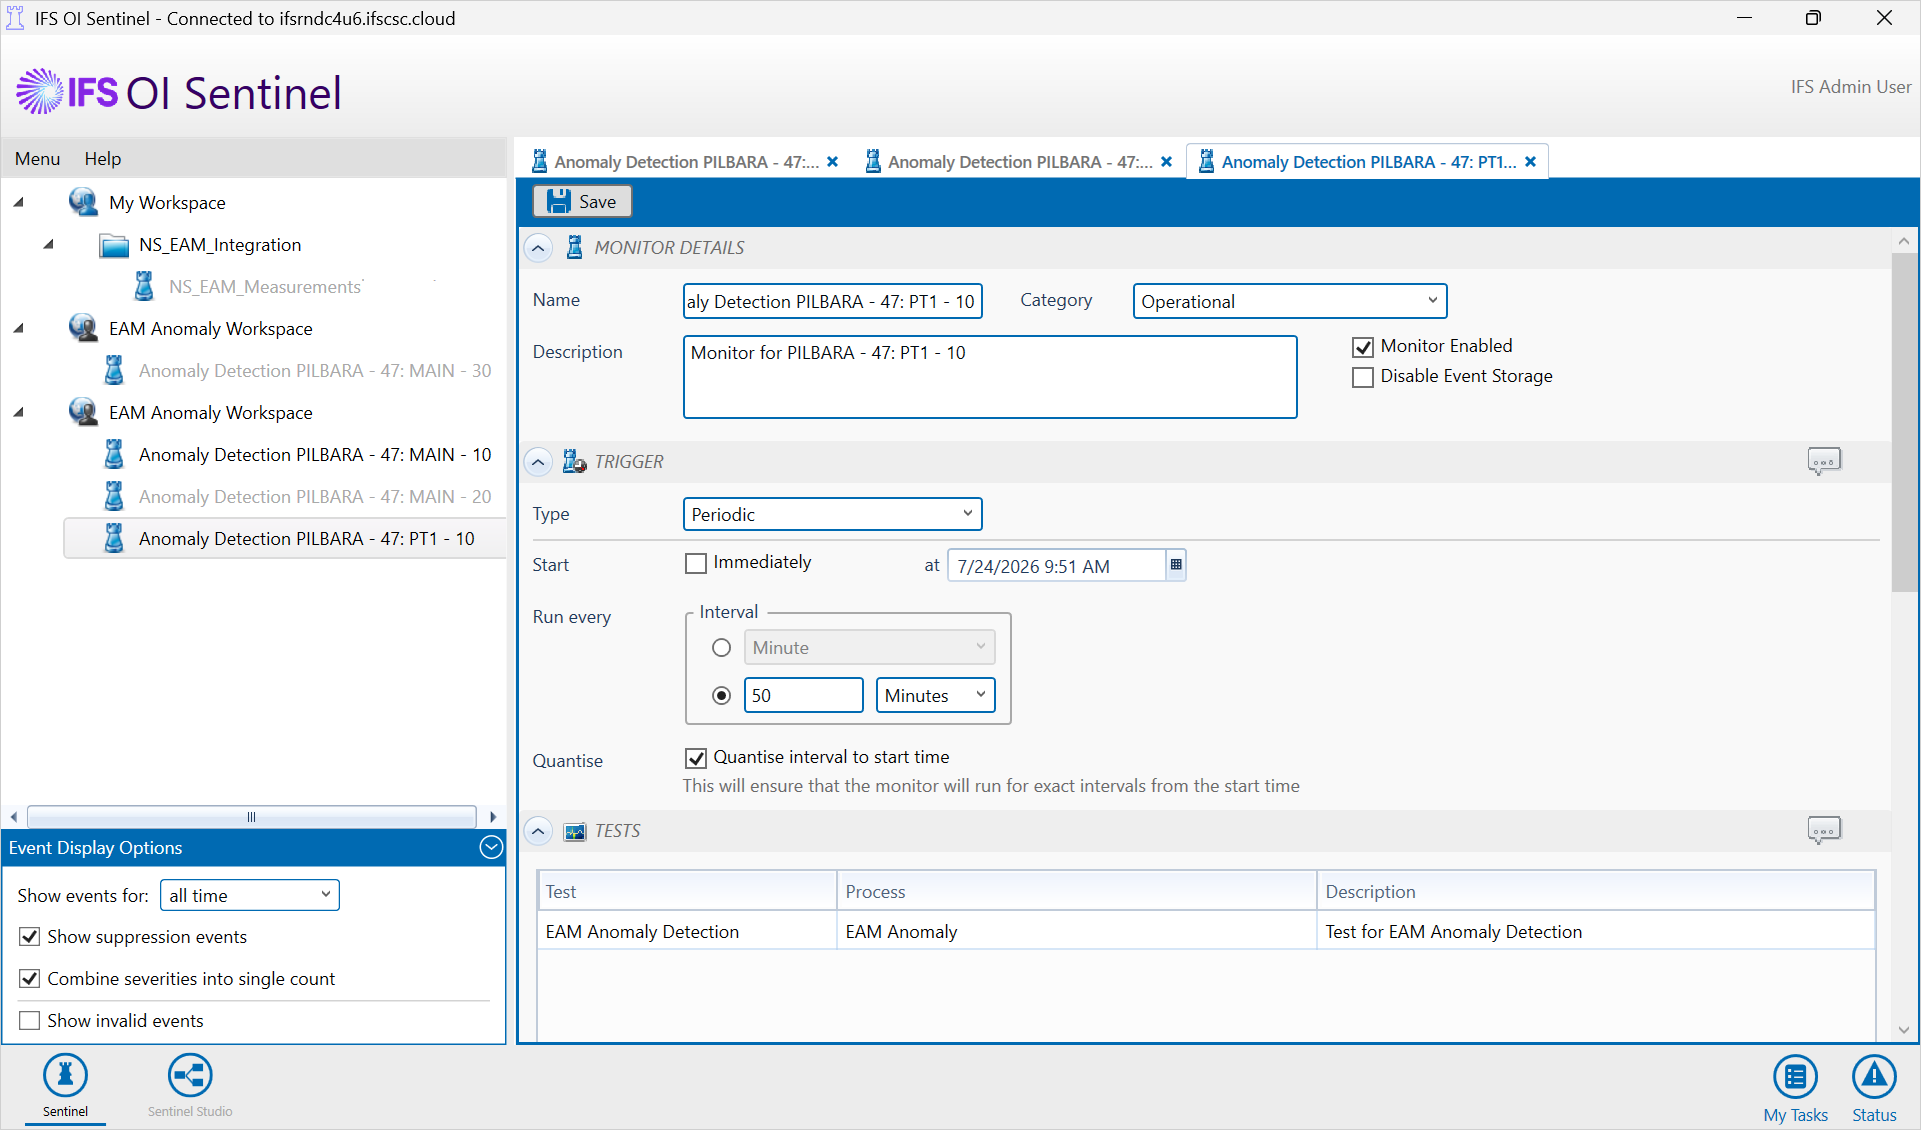
Changes made to the anomaly detection configuration are reflected in the associated Sentinel monitor.
Removing the Template - Attribute mapping removes the monitor from Sentinel.
Detections generated by the monitor are available as anomaly detection records in IFS Cloud.
Viewing Anomaly Detections
Anomaly detections generated by the corresponding Sentinel monitor can be viewed in IFS Cloud.
To view anomaly detections, open IFS Cloud and navigate to Maintenance > Asset Performance Management > Anomaly Detections.
The Anomaly Detections page contains Open, Reported, and Ignored sections. These sections display anomaly detection records and include information such as the object, site, test point, parameter, detected value, occurrence time, severity, and duration. The Reported section also includes related work order and task number.
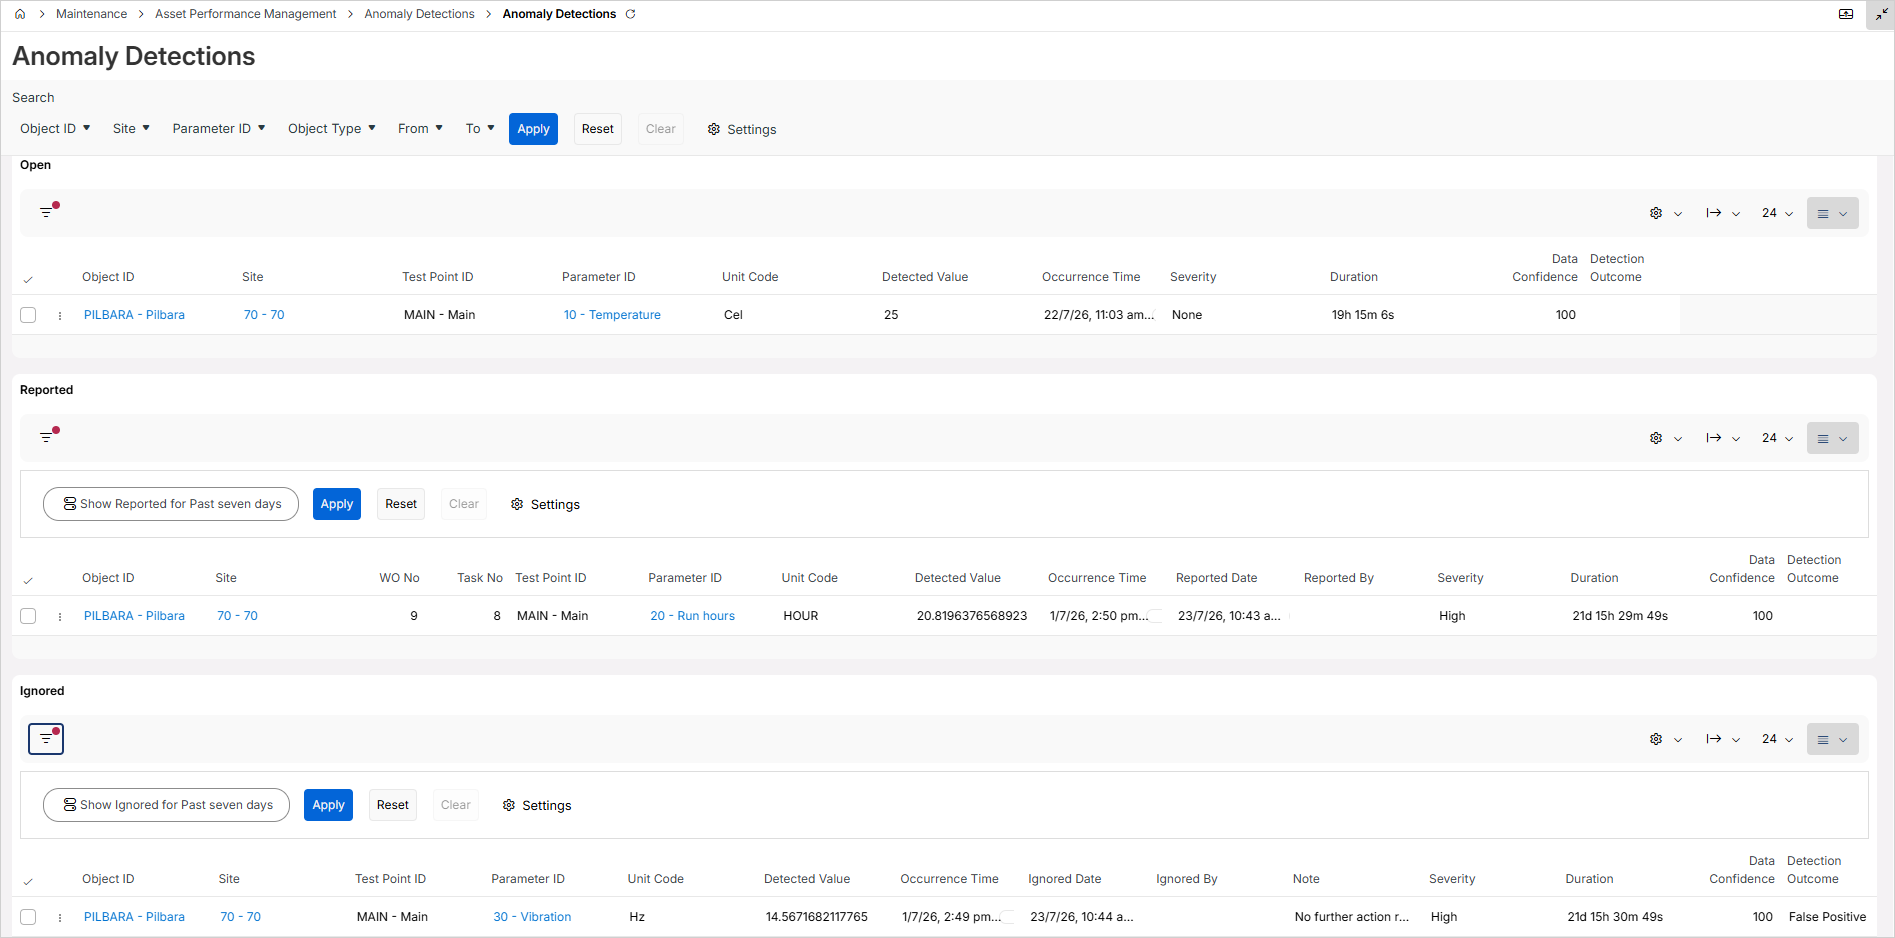
Note:Timestamps displayed on the Anomaly Detections page are shown in the user's configured time zone. Hover over a timestamp to view the corresponding UTC value.
Release History
- Anomaly Detection Configuration 26R1 (Cloud Release)