Filter Bar
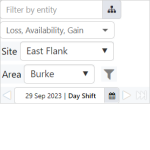
The Filter Bar filters the events shown in the entries table and the timeline, enabling you to filter the events by entity, event type, site and area, and by applying a customised time period.
The Filter Bar filters the events shown in the entries table and the timeline, enabling you to filter the events by entity, event type, site and area, and by applying a customised time period.
This article applies to Case Management in versions 4.9.3 and later of IFS OI Explorer. Case Management is all about activities and changing statuses surrounding events for cases that have been manually raised in Explorer or Shift Log, and those raised in source applications such as IFS OI Sentinel. A…

IFS OI Explorer allows you to link to a saved trend via a URL. There are 2 ways of doing this: Sharing the link through the IFS OI Explorer framework, or manually entering the URL. This article examines both methods, and also shows you how to remove the Explorer frame from the trend.
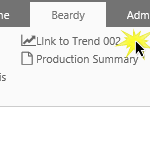
This article explains how to create a templated trend. A link to the trend is added to a template of an entity, so that it appears on an entity's Table of Contents tab on the Explorer ribbon. Tasks are performed in IFS OI Server Managment as well as IFS OI Explorer to achieve this.
This article explains how to create a templated trend. A link to the trend is added to a template of an entity, so that it appears on an entity's Table of Contents tab on the Explorer ribbon. Tasks are performed in IFS OI Server Managment as well as IFS OI Explorer to achieve this.

You will probably want to regularly save your trend as you are working on it. This article describes 3 ways to save your trend.
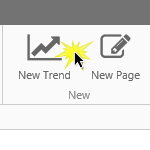
An Explorer trend displays time-series data, such as tags and attributes, over a selected period.
The trend can have multiple hairlines, and you can add comments to the trended tag or attribute.
See how to add and view trends, and how to use the calculation editor within the trend.
The Analysis panel in the Explorer Trend extends the capabilities of the trend to enable the creation and visualization of complex models directly against any timeseries data in the system.
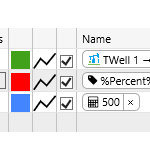
The trace table displays details about each trace on the trend. Up to 20 traces can be added to a trend, and each can be accessed and edited through the trace table.
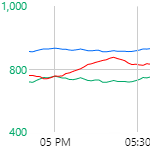
This article describes the features of the trace window, which displays a chart of the trace data along a X, and one or more Y-Axes.